
When it comes to options trading, there are many different measures of probabilities. Most of them sound very similar: probability of ITM, probability of OTM, probability of touch… but actually all of them represent something different. It is important to be aware of all the differences so you can take advantage of all these indicators. In this article, I will present and explain all these different probabilities that an option trader needs to be aware of.
What is the Probability of ITM

ITM stands for In-The-Money, so the probability of ITM is the probability that an option will expire In-The-Money.
Put options are ITM when the underlying’s price is below the strike price and call options are ITM when the underlying’s price is above the strike price. If you didn’t know this yet, I recommend checking out my lesson on options trading basics.
The probability of ITM can give you an idea of what the market expects from an asset. Furthermore, the probability of ITM should influence your option strike selection. If you want to trade conservatively with a high probability, you should find a strike price(s) that give you a high probability of profit.
A good alternative to the probability of ITM is the option Greek Delta. These two usually are almost the same (Delta normally is slightly greater). On the right-hand side, you can see a table in which the probability of ITM and Delta are compared for different options. As you can see, Delta is always slightly greater. Nevertheless, it can be used as an alternative for the probability of ITM.
If you buy a call option that has a 60% probability of expiring ITM, you might think that this is your probability of profiting on that long call position. However, as you have to pay a debit for that call option, your breakeven point is moved against you. Therefore, the probability of closing that long call position for a profit is actually lower than the probability of ITM.
The probability of ITM is not the same as the probability of profit.
 What is the Probability of OTM
The probability of OTM is more or less exactly the opposite of the probability of ITM. The probability of OTM shows the probability that an option will expire Out of The Money (or worthless).
The probability of OTM can be calculated by subtracting the probability of ITM from 100:
1 – Probability of ITM = Probability of OTM
This can also be used to get an idea of what the market expects from an asset’s price. Furthermore, this is the probability to look at when selling options. When selling options, you want the sold options to lose some or ideally all of their value and the probability of OTM shows the probability of exactly this happening.
In other words, when selling options, you should ideally find options that don’t have a too low probability of expiring worthless/OTM.
Note that the probability of OTM does not show your probability of profiting on an option trade. When selling options, you collect a credit which will move out your breakeven points and thereby, increase your probability of profiting. This is not included in the probability of OTM.
The probability of OTM simply shows the probability of the underlying’s price being below the strike price for call options and above the strike price for put options.
What is the Probability of Touch

The probability of touch shows the probability that the price of the underlying will touch (or breach) the strike price.
Usually, the probability of breach is about 2x the probability of ITM. Here is a brief example:
XYZ is trading at $100 and you decide to buy the 110 call option that has a 30% probability of ITM. The probability of touch for this option will be around 60%. This means that the theoretical probability that XYZ’s price will rise to $110 sometime before expiration is around 60%.
While the probability of ITM and OTM focus on the expiration date, the probability of touch focuses on the time before that.
From the fact that the probability of touch is about 2x the probability of ITM, you can learn a lot. Just because you sell an option with a high probability of OTM, does not mean that it won’t go against you and show a paper loss sometime before expiration.
Here is yet another example to clarify this:
ABC is trading at $45 and you sell the OTM put option with a strike price of 38. The probability of OTM for this option is 70%, which is fairly high. In other words, there is a 70% probability that ABC’s price will be above $38 on the expiration date.
The probability of ITM for the 38 put option is 30% (100 – 70 = 30). Therefore, the probability of touch is about 60% (2 x 30). A probability of touch of 60% means that there is about a 60% chance that ABC’s price will drop down to $38 before the expiration date.
So actually, the probability of that happening is greater than the probability of it not happening. Your short put position will show a paper loss when this happens.
If you now have the trading approach to cut losses quickly, you probably would close your position for a loss. This isn’t necessarily the smartest thing to do though. If looked at the probability of touch when entering your position, you would have seen this price drop coming (with a 60% probability). Thus, you probably would have held on to your position.
In cases like this, it isn’t unlikely to see the trade turn around again. My point is that due to the probability of touch being 2x the probability of ITM, it is likely to see trades go against you (when selling).
Many option trades show a paper profit sometime before expiration. However, if you manage to hold on to them, they often turn around. Therefore, the trading approach ‘cut your losses quickly and let your winners run’, is not applicable to options selling.
Nevertheless, you shouldn’t hold on to losers forever, especially if you are trading undefined risk strategies. Always define your risk before opening a trade and then stick to this max risk level. Just make sure to give the underlying’s price some room to move, so that your losing trades still can turn around and become winners.
What is the Probability of Profit (POP)
The probability of profit factors in the premium received/paid which moves the breakeven point of a trade. So the probability of profit shows the theoretical probability that a trade will be profitable at expiration.
A common misconception is that the POP is the probability of reaching max profit. This is not true. The POP simply shows the probability of making at least a penny on a trade.
Let’s go over another example:
You sell a call (credit) spread on XYZ (XYZ is currently trading for $265). The short strike of the call spread is 270 and you collect $1 for the entire spread. This means that your breakeven point is at $271. Let’s say the probability of profit is 65%.
This means that the probability that XYZ’s price will expire at least one penny below $271 is about 65%. If XYZ’s price is at $270.99, the call spread won’t reach max profit.
What is P50
P50 is another very useful probability. It shows the probability that your trade will reach 50% of max profit (for defined risk trades). I have only seen this probability displayed on the broker platform tastyworks. Most other brokers probably don’t have this feature.
A wide variety of different backtests from tastytrade have shown that taking profits at 50% of max profit is ideal for most short option strategies. That is also why they show you the probability of reaching 50% of max profit.
The probability of reaching 50% of max profit usually is higher than the POP. This is the case because 50% of max profit normally is reached before the expiration date and therefore, the trade can be closed earlier.
This is how tastytrade describes their P50 calculation:
“The p50 feature takes the trade you’ve loaded onto the trade page and runs it through a monte carlo style simulation, and calculates the theoretical probability that your position reaches 50% profit over 10,000 occurrences.”
How to use the different probabilities
Now you know what the different probabilities mean. However, you don’t necessarily know how to use the probabilities for your trading. That’s what we will get into now.
The probabilities of ITM/OTM can be used to give you an idea of what price movement the market expects from an asset. Furthermore, you can use these probabilities for the strike selection. For instance, when you are setting up a credit spread, you can look at the probability of OTM to find a fitting short strike.
The probability of profit gives you an idea of the likelihood of winning on a trade. POP takes another important factor, namely premium into account and therefore, you should rather look at POP than at the probability of ITM/OTM.
Just because an option has a high probability of expiring ITM, does not mean that it is a good buy. If you factor in the premium that you have to pay to open the long position, the probability of actually making money is much smaller than the probability of that option expiring ITM.
So the probability of profit is one of the most important aspects to look at before sending an opening order for a trade.
The probability of reaching 50% of max profit (P50) can also give you great insights into a trade, especially if you are planning on taking profits at 50%. However, if you put on a trade because it has a high p50 number, you should not try to go for max profit. P50 is especially useful for option premium sellers. Generally, it is a very good idea to take profit at 50% of max profit on most short option strategies like credit spreads, short iron condors, short strangles etc.
The probability of touch figure should also influence your trading. If a strategy has a high POP and a high probability of touch, you shouldn’t cut losses as soon as the trade goes slightly against you. Remember that most option trades are tested and show paper losses before expiration. That is also the reason why the probability of touch is 2x the probability of ITM.
Just because the underlying’s price moves against you, does not mean that it can’t turn back around. Just make sure to define your risk before putting on a trade so that you protect yourself.
Call Spread Example
Here is a brief example of all the probabilities on a call credit spread:
The underlying asset is QQQ and was trading at $171.5 at the time of making this example trade.

As you can see on the image above, the probabilities are:
- POP: 64%
- P50: 73%
- Probability of ITM: 42%
- (Probability of OTM: 58%)
- Probability of Touch: 84%
The max profit of the call spread is $214 and the max loss is $286. If you are familiar with call spreads, you should know that the max profit is equal to the total credit collected. Thus, the breakeven point can be calculated by adding the premium collected to the short strike price (which is 174). So the breakeven point for this call spread is $176.14 (174 + 2.14).
Just like I presented earlier, the POP is greater than the probability of ITM because the premium collected moves out the breakeven point. So even though the probability of the short option expiring ITM is 42%, the overall probability of having a profit on the expiration date is 64%. Note that this does not mean that this trade has a 64% probability of reaching $214 max profit. There is a theoretical probability of 64% that QQQ’s price will expire at least one penny below $176.14, the breakeven point.
The probability of reaching 50% of max profit ($108) is about 73% which is even greater than the POP.
Last but not least, the probability that QQQ’s price will test the short strike sometime before the expiration date is 84% which is 2x the probability of ITM (2 x 42 = 84). In other words, it is quite likely that the call spread will be tested and show a paper loss sometime before expiration.
Here is an infographic that displays the probabilities of the call credit spread visually:
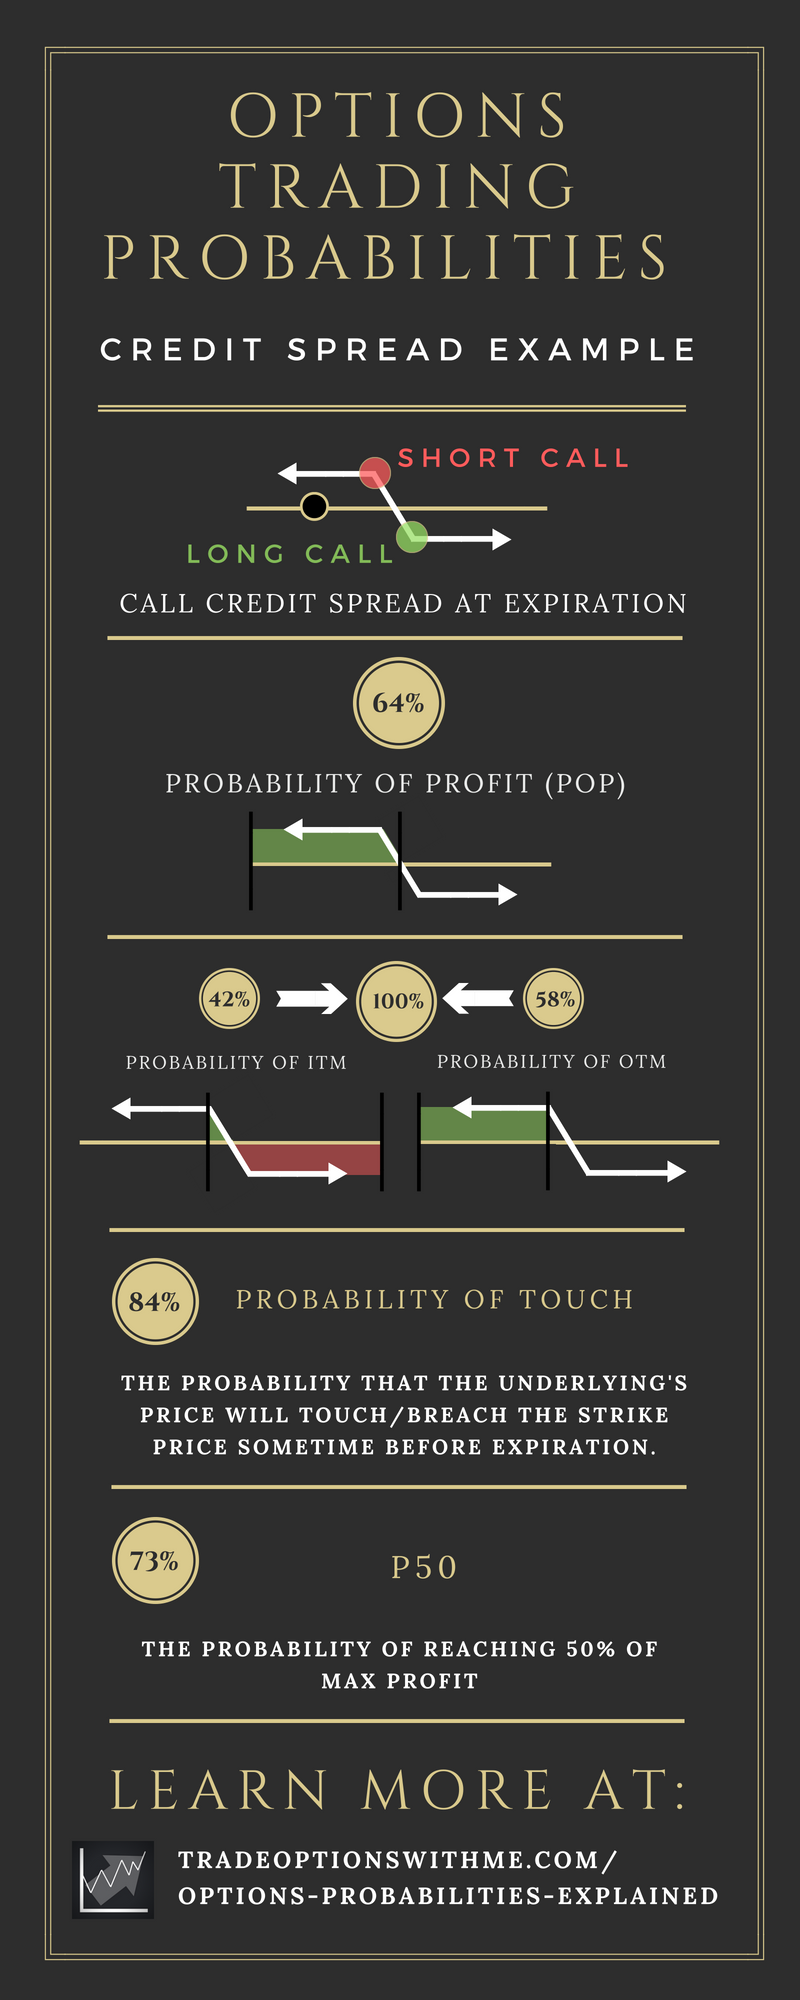
(If you want to use this infographic, go ahead. Just make sure to link back to this article.)
Hopefully, this example helps you with the understanding of the different probabilities.
Conclusion
Even though probabilities are important in options trading, they aren’t everything! It is important that you don’t only look at the probabilities of an option trade.
Just because a trade has a high probability of profiting, does not mean that it is a good trade. Make sure to always look at other essential factors like max profit, max loss, risk to reward ratio, implied volatility, days to expiration… as well.
For instance, a trade with a 90% probability of profit might sound good. However, if that trade only has a max profit of $5 and its max loss is $1000, the trade is bad!
Normally the following is the case: the higher the probability of profit, the lower the max profit and the greater the max loss.
So make sure to look at the probabilities AND other important factors!
Hopefully, you found this article helpful and learned how the presented probabilities can improve your trading performance. Sadly, not all brokers show these probabilities. On the following image, you can see that all of the probabilities can be displayed on a single page within tastyworks:
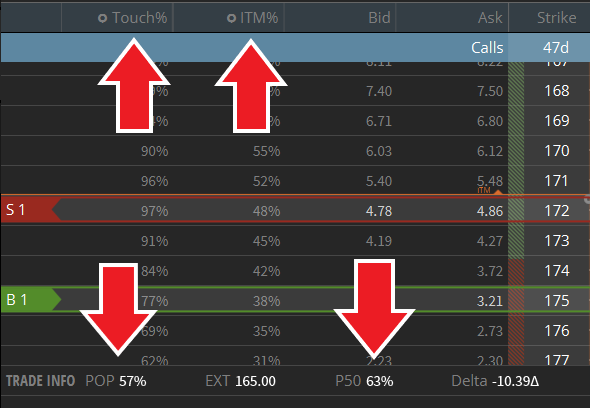
That is why I use tastyworks, the only broker I know that shows all of the above probabilities.
If you want to learn more about tastyworks, make sure to read my tastyworks review!
Great article! Not often do I find a simple explanation for ITM and OTM. What I was most fascinated about though was the P50, I had never heard of that?
P50 may be more toward my trading style since I do like having more winning than losing trades for psychological reasons. I find that more frequent, smaller wins allows me to better abide my trading rules and stick to the plan.
Although, I’ve had to re-adjust a lot of my back testing to suit my trading style with more wins and less losses, I’m more comfortable in my own trading skin.
Tastyworks is a platform I’d have to check out for this reason, do you recommend them for anything else other than P50?
Cheers Rohan
Thanks for the comment Rohan!
I absolutely recommend tastyworks for something else than the simple P50 feature. The P50 feature is just one of many examples of their great platform. I use tastyworks for all my trading because they are so great.
If you want to learn more about tastyworks’ features and why I recommend them, make sure to read my tastyworks review.
Hi Louis,
Great explaination especially about P50. I notice, sometimes when i haggle , the P50 appear to be P50<1%. What does it really mean ya? Tq ?
Regards,
Jaja
Hi Louis, Thanks for this detailed and thorough article. I feel I have a much better understanding of option trading probabilities. I also appreciate the section on the Probability of Touch, which is a new concept for me.
One thing I am learning more about is trading options around earnings. I am curious if you can speak to how earnings seasons can affect the ITM and OTM probabilities for stocks. Could you look at the probabilities, for example, and get a sense of the direction that a stock cold move prior to earnings?
Thanks for any insights you can provide!
Thanks for the comment Laura.
As you know from my article about trading options on earnings, implied volatility (IV) usually increases before an earnings announcement. An increase in IV means that the market expects a big upcoming move. This will also impact the probability of ITM/OTM. If a big move is expected, the probability that an option will expire OTM decreases and simultaneously the probability that an option will expire ITM increases.
Hopefully, this makes sense to you. If a price will likely move a lot soon, it makes sense that options have a higher probability of expiring ITM than if no big move is expected.
When setting up an earnings trades, you could definitely use these different probabilities. Ideally, you should set up a strategy that hasn’t a very low probability of profit.
I don’t really know a way to use probabilities to predict how a stock will react to earnings though.
I hope this could help you out.
Hello Louis,
I’ve lost tens of thousands of dollars just buy buying calls or puts right before earnings and either I chose the wrong strike or there was no up move at all
I always thought it’s best to sell premiums via credit spreads during earnings because the IV is much higher than the underlying’s HV
Please give me your thoughts on this. Thanks.
Lawrence
Thanks for your comment. It is correct that IV usually rises leading up to earnings. On earnings, however, IV tends to drop quite a lot which is great for overall short premium strategies. Credit spreads are a way of trying to profit from this. However, there are other strategies that can profit much more from this IV drop than credit spreads. Furthermore, you take a directional bet with a credit spread which can be quite risky on earnings as prices often tend to move a lot after an earnings announcement. So when you get caught on the wrong side, the IV crush won’t be enough to compensate the losses incurred through the price move of the underlying asset.
I have an article on how to trade options on earnings. In it, I go over this IV drop and suitable strategies much more thoroughly. Just note that this strategy can be quite risky.
Hopefully, this helps.
Hi Louis
On Sky View Trading recommend we use 30% Prob ITM that equal to 60% Prob of Touch, right? That gives good Credit but may need adjustment if the price against us. So I get confused which one to choose 30% or 42% Prob ITM? As 84% POP sounds good to trade. Thanks
Hi Harry,
If a strike has a 30% probability of ITM, it should have a probability of touch of about 60%. So yes, you are right.
As to which probability is best, I can’t give you a concrete answer. It really depends on the situation and your personal preferences. In my opinion, neither 30% or 42% is better. It just really depends. But as long as you collect enough credit and have a decent probability of success, you can’t really go wrong.
Hi Louis,
Because the Prob ITM changes throughout the option’s life cycle, how do we know that we are getting in at the right probability ITM. i.e. I sell at a 30% Prob ITM, so I should have a 70% chance the option expiring worthless by expiration. But the next day the prob ITM changes to 50% and never goes back to 70%. So is the 70% Prob ITM I entered not valid anymore, and it is now a 50% prob ITM trade?
Thank you
Hi Tim,
I’ll use your example to clarify this. If the probability of ITM changes from 30% to 50%, it doesn’t make the original 30% probability of ITM invalid. At the time that you opened your position, the option had a 30% probability of expiring ITM. Now it changed, but that shouldn’t disturb you too much.
In terms of underlying price, this situation probably looked something like this: you sold a call option $10 above the current price of the underlying. One day later, the underlying’s price moves up by $5, thus the option isn’t as far OTM anymore and therefore, the probability of ITM increased.
So now the question is how do we know if we got in at the right price (of the underlying)? The answer is, we don’t. But we try to open as favorable positions as possible.
Something like this will happen very often as prices tend to swing around a lot. If they move in one direction, the probability of ITM will increase and in the other direction it will decrease. But as long as you open your trade with an initial good probability of success and otherwise favorable setup, you are doing everything right.
I hope this helps.
Wow, thank you for clarifying, that helps. So I guess this topic kind of falls into portfolio management and trying to stay ‘delta neutral.’ One strategy would be to stick to the probabilities and let the stock price move around until expiration and hope that the probabilities work out, and that we end with a win. The other would be to adjust the trade. When would you recommend to adjust the trade and realize that the initial entry will not work out, and when do you just hold the position until expiration?
Thanks again.
Hi Tim,
The specifics vary from trade to trade. However, I recommend having a clear plan for when to adjust before you open a trade. I actually have an entire article dedicated to adjusting option strategies. I recommend checking it out for a thorough answer. If you still have any questions left afterwards, let me know.
I’m a bit confused. How can the probability of achieving 50% profit ($108) be higher than the probability of profit (achieving $0.01 profit)? If POP is 64% how can setting a higher bar (50%) have a higher chance?
Hi Matt,
Thank you for your question. POP is the probability of achieving a profit at expiration, whereas P50 is the probability of achieving 50% of max profit anytime between now and the expiration date. It is likelier that a position will temporarily achieve 50% of max profit sometime in the future than that the same position will be profitable on a very specific day in the future. In simple terms, P50 has a lot more chances than POP.
I hope this makes sense. Otherwise, definitely let me know.
Hi Louis,
Mind if I ask a question? On this trade the maximum profit is $214 and the maximum loss is $286. We don’t know what the odds are of taking the maximum profit because POP is just that we are in profit (not max profit), but with tastyworks we can know the probability of 50% of max profit, which is $107 right? The probability of hitting P50 is 73%. Now if we assume that the probability of not hitting P50 and expiring at max loss is the other side of this probability (which I don’t think it is) so 27% then we can run the calculation of whether this trade would be profitable over many instances as 0.5 x $214 = $107 x 0.73 = $78.11. Which means that run over a large number of instances we would take on average $78.11 per trade. However, we will lose $286 x 0.27 = $77.22 on average per trade. So we have a slight edge on this trade even assuming that we hit maximum loss the 23% of the time we don’t touch P50. Am I calculating this correctly? And am I correct in saying that the 23% of the time that we don’t hit P50 we will not suffer the maximum loss every time so actually our edge is better than my above calculation?
Thanks a lot, love the site BTW
Hi Ashley,
Thanks for your comment. Firstly, I just want to say that all these probabilities are purely theoretical. It’s certainly a good idea to calculate things such as expected value but you should always remember that this shouldn’t be more than a rough guideline.
As far as I can see, your calculations seem to be correct.
Let me know if you have any other questions or comments.
Hi Louis,
When trading option strategies, should one let the probabilities play out until expiration? If one does planned adjustments, it may affect probability of winning over large number of trades, and thus create negative expectancy. What are your thoughts or any backtest results i n this aspect?
Thanks very much for this informative blog.
Manish
Hi Manish,
Thanks for the question. You are certainly right in that adjusting your trades will have an effect on the expected return. This effect, however, doesn’t necessarily have to be negative. Tastytrade has done a bunch of studies on adjusting and closing trades early. As long as the adjustment doesn’t increase your risk and dramatically decrease your probability of profit, it likely will have a positive effect on your expected return.
Tastytrade’s studies have also mostly shown that aiming for a conservative profit target such as 50% outperforms holding till expiration. This also makes sense since closing trades early decreases the time spent in each trade. This allows you to make more trades in the same amount of time with a higher win rate.
I hope this answers your question.
Hi Louis –
Thanks for this site. It’s terrific. I’m a novice, and appreciate the way you explain things.
Question regarding the Probability of Touch. If PoT is double the PoITM (one example above was 42% ITM, making PoT 84%), why wouldn’t the owner of the option sell it at the point it touched the strike price (before expiration)? You refer to this a “paper” loss, but wouldn’t it be a real loss if the option owner sold it?
I’m sure I’m missing something – please let me know what it is!
Thanks again,
Tom
Hi and thanks for the comment.
The P&L of the option position when the underlying touches its strike price depends on the entry price of that position. Sometimes, it will be a profit and other times it will be a loss. But if there still is enough time left, it might not make sense to close the position from a risk/reward standpoint. If, for instance, the profit is only $5 and the risk on the trade is $200, it doesn’t make sense to close the trade at such a small profit compared to the risk. Even with an 85% win rate, this would be a losing strategy in the long run.
I hope this answers your question.
I’ve been trading 0DTE SPX Iron Condors. When I enter the trade the breakeven prices are at strikes that the TOS option chain shows Probability OTM ~92%. Therefore, the trade should have .92 X .92 = .8464 probability of “winning.” However, the TOS Risk Profile probability is ~54%. I understand that POP is not actually the same as probability OTM, but what am I doing wrong?
Why would the probability of winning be 0.92 X 0.92? For an iron condor to be profitable, the underlying price has to be between the two short strikes (assuming you’re trading short iron condors). That profitable range is significantly narrower than just limiting one side which would be the case if you only sold one side.