
Beta weighting is a fundamental risk management technique that is commonplace in every professional trading institution. But sadly, many retail traders shy away from it because, at first glance, it does seem complicated.
My goal with this article is to change this. There is a reason why so many professional traders use beta weighting on a daily basis! After reading this article, you should be able to fully understand this reason and apply beta weighting to your own portfolio.
Video Breakdown of Beta Weighting
In the following video, you will learn everything you need to know about beta weighting. So make sure to check it out.
What is Beta?
Before we get into what beta weighting is, it is important to first understand what beta is. Beta is a measure of volatility relative to some benchmark expressed on a continuous scale. The highly liquid ETF SPY that tracks the S&P500 index is the most popular benchmark used to calculate the beta of a security.
Even though it isn’t the same, the beta of a security can be thought of as the volatility-adjusted correlation to the given benchmark. Here is an example to clarify this:
For our example, let’s look at the beta of a fictitious stock XYZ. We will use SPY as a benchmark for this beta. The following table displays what different beta values mean.

More concretely, if XYZ has a beta of 0.5, it means that XYZ is 50% less volatile than SPY. In simple terms, this would mean that for every $1 up-move in SPY, XYZ moves up by about $0.5. The same goes for a down-move. Note that, in reality, the correlation never is this accurate.
A beta of 1.4, on the other hand, would mean that XYZ is approximately 40% more volatile than SPY, whereas a beta of -1 would mean that XYZ has the same degree of volatility as SPY but in the opposite direction. So basically, XYZ is a mirror image of SPY.
Even though they are similar, beta is not the same as the correlation coefficient. Beta is more a measure of risk than an expression of the tendency that prices will move in sync. Nevertheless, correlation plays a key role in the formula used to calculate beta. That’s why, when calculating the beta of a security, it is important to choose a related security as a benchmark. Otherwise, the beta value won’t tell you anything.
If you, for instance, want to calculate the beta of a technology stock, it would make more sense to choose QQQ – an ETF that tracks NASDAQ stocks, as a benchmark, than GLD – an ETF tracking gold prices. The more correlated the benchmark is to the security, the better. Furthermore, it is a good idea to choose a highly-liquid, heavily traded, and thus efficient security such as a major market ETF. That’s why SPY is a great choice for most equities.
To recap, a beta greater than 1 means that a security is more responsive than the benchmark, whereas a beta less than 1 means that it is less responsive. The same is the case for negative betas with the only difference being the direction of the price moves.
The most common usage of beta is to get an idea of the volatility risk of certain securities compared to the overall market.
Why You Need to Beta Weight Your Deltas
First of all, let me briefly recap what the option Greek delta is. It is fundamental to have a good grasp of delta to understand beta weighting.
The delta of a position tells you its directional exposure to changes in the underlying asset. For example, a normal stock position of one share will have a delta of 1, since it will gain $1 for every $1 up-move in the stock price. The delta of options positions can vary widely.
Generally, the greater your delta is, the more bullish the position is, whereas a highly negative delta means that the position is very bearish. If you have multiple positions on the same security, you can simply add up all the deltas to get your overall directional exposure to that security. This is a great way to measure the directional risk of your position(s).
With that being said, you can’t really do this if you are trading more than one underlying. But as your portfolio likely will have positions in multiple different securities, it would be great to be able to analyze the directional risk of your portfolio as a whole.
Theoretically, you could add up all the deltas of different positions on different securities, but the result wouldn’t actually tell you anything. The problem is that a delta of 10 on one underlying wouldn’t have the same meaning as a delta of 10 on another.
For instance, a delta of -10 on SPY can’t be compared to a delta of -10 on TSLA. SPY tracks a major market index that rarely moves more than a few dollars in a single day, whereas TSLA is a highly volatile stock that easily can move $50 in one trading session. Therefore, a -10 delta position on TSLA is much riskier than a -10 delta position on SPY.
But simply adding up all the deltas would ignore this difference. That’s why we need some method to weigh the deltas of different positions. To add comparability, a position should be weighted according to the volatility risk that it poses relative to others. That’s where beta comes in to play.
What is Beta Weighting
In simple terms, beta weighting transforms all your deltas into one comparable, standardized unit of deltas. It adjusts the delta of each position so that it accounts for the volatility of its underlying security. Instead of simply adding up the deltas of each position, you multiply each delta by a certain factor before adding them up.
This is how you would beta weight the delta of one of your positions.
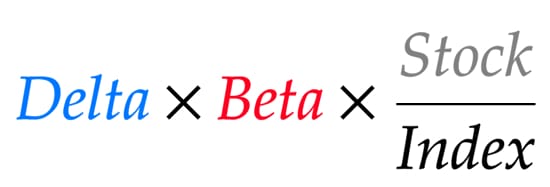
With the following variables:
- Delta: The delta of the position
- Beta: The beta of the underlying
- Stock: The price of the underlying
- Index: The price of the benchmark security
Doing this for the deltas of all your positions and adding up the results will give you the beta weighted delta of your overall portfolio.

But what does this actually tell you?
The beta weighted delta of your portfolio tells you the directional exposure of all your positions to the overall market. In other words, it states how your total portfolio P&L is affected by price changes in the market (or benchmark index that you used). For a $1 up-move in the benchmark index, your total P&L should change by about the amount of this delta.
Even though the beta weighted delta on its own is useful, it only gives you a very limited and static outlook into your portfolio’s risk profile. Together with prices, the deltas of your positions also change. To account for these changing deltas, it is possible to create a risk graph for your entire portfolio. This graph could, for instance, look something like this:
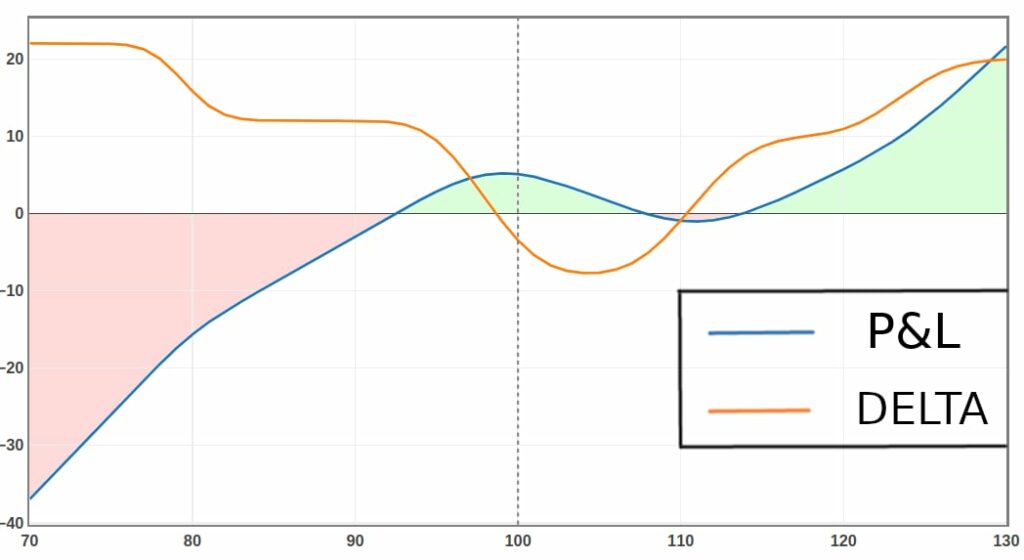
Just like normal payoff diagrams, the y-axis represents the P&L of the position and the x-axis describes the price of the underlying security. Here the underlying security is the benchmark index (e.g. SPY).
The orange line represents the beta weighted delta of your portfolio and the blue line represents its P&L. As you can see, this portfolio profits most if the market either stays where it is right now (around 100) or moves up and beyond 120. This portfolio is very much exposed to big price drops in the market.
Besides allowing you to gauge your market risk, beta weighting also allows you to estimate the expected daily P&L change of your portfolio. To do this, you would first have to calculate the expected daily move of the benchmark index and then multiply the expected move by the beta weighted delta of your portfolio. This will give you a rough estimate for a one standard deviation expected daily P&L change of your portfolio. You can divide this by your total account capital to get the expected change in percent.
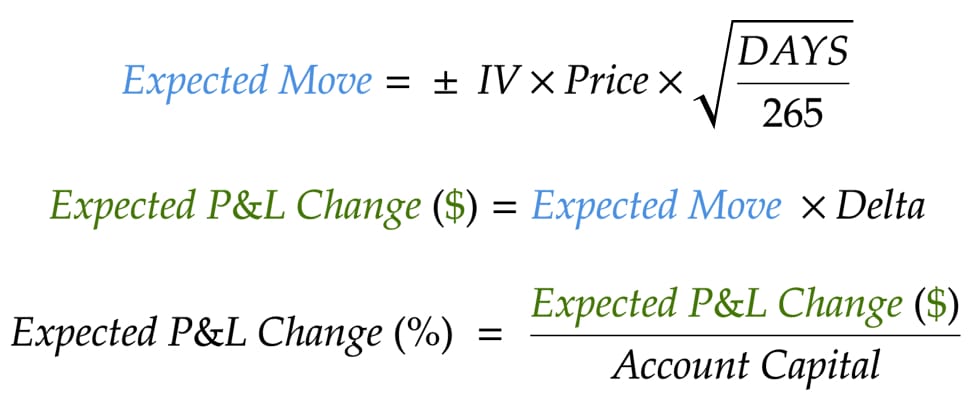
These calculations assume 265 trading days in a year, a constant delta, and a normal distribution of stock returns. These aren’t necessarily the most realistic assumptions. Nevertheless, this expected move can be a good guide to set expectations for the daily volatility of your portfolio’s P&L.
If you want to learn more about the expected price moves, check out the following video:
Here is a brief example in which I go through the process of determining the expected price change with XYZ as the benchmark:
Let’s say XYZ is trading at $100 and has an implied volatility of 20%. Furthermore, our portfolio has a total account capital of $30 000 and a beta weighted delta of 45. To calculate the 1 day expected price change of your portfolio, you would have to plug in the following values for the variables in the aforementioned formulas:
- IV: 20%
- Price: $100
- Days: 1
- Delta: 45
- Account Capital: $30 000
The results are:
- Expected Move: ± $1.23
- Expected P&L Change ($): ± $55.3
- Expected P&L Change (%): ± 0.18%
This means that XYZ is expected to change by about $1.23 in a day. This would lead to daily P&L fluctuations of the size of approximately $55.3 or 0.18% (or less) in your portfolio.
The Advantages of Beta Weighting
Before we move on to managing your market risk through beta weighting, let me recap why beta weighting is so helpful.
- Comparability: Beta weighting your positions, normalizes all of their deltas to one unit. This allows you to do a true ‘apples to apples’ comparison. Without beta weighting your deltas, you can’t reliably compare the directional exposure of different positions.
- Portfolio Risk: Beta weighting allows you to create a payoff profile for your entire portfolio. This is a great way to evaluate and manage your directional market risk.
- Expected Move: Last but not least, beta weighting allows you to estimate the expected (daily) price fluctuations of your overall portfolio.
Risk Management & Beta Weighting Your Portfolio
At the end of the day, trading always comes down to managing your risk. So how does beta weighting help you manage your risk?
Firstly, it is important to have an overall directional assumption of the overall market around which you can orientate your portfolio. In theory, this can be everything from very bearish to very bullish. It can, however, be hard to always have a clear directional bias on the market. Furthermore, being too directional can expose you to big risks. Therefore, it can be advantageous to stay delta-neutral.
But what exactly does delta-neutral mean?
A delta-neutral position is one with a delta somewhere around 0. Such a position is not significantly affected by changes in the underlying’s price. An iron condor would be an example of a delta-neutral options strategy. It achieves max profit if the price of the underlying stays right where it is. Since stock prices usually move in relatively small ranges, this can be a great neutral trading strategy.
Think about it. The vast majority of days, SPY doesn’t change by more than $1. So why would you construct a highly directional portfolio if you can just stay neutral or slightly directional?
To make this even clearer, let’s compare the payoff diagram of a classic stock portfolio to the payoff of a delta-neutral one. For this, let’s assume both portfolios expire in 45 days. Which of the following portfolios would you rather have?

The first long-delta portfolio clearly outperforms the latter if the market has a huge rally. But if there is no huge rally or even a decline, the payoff profile of the delta-neutral portfolio is certainly preferable. All in all, a delta-neutral portfolio is much more versatile and leaves much more room for error than a highly directional one.
I hope these examples show you how having a neutral portfolio can be advantageous. With that being said, you obviously still can have some directional skew to your payoff profile. In a bull market, for instance, it can be favorable to be slightly bullish. Just make sure to keep your directional exposure in check.
As a rough guideline, you could try to keep your beta weighted delta of all your positions below 0.5% of your total account capital. So if you have $10 000 in your account, try to keep your beta weighted delta between -50 and 50.
To achieve this, you will have to balance out positive and negative delta positions. Next up, let’s take a look at how beta weighting should affect the process of opening and managing trades.
Beta Weighting & Finding New Trades
Before opening a new position, you should always first evaluate its effect on your overall portfolio. You should check if the position is a good fit for your portfolio. Here are two questions to consider before opening (or closing/adjusting) positions:
- How does it affect the risk profile of your portfolio?
- Does it add or reduce directional risk?
If you are trying to stay market neutral and your portfolio currently has beta weighted delta of 200, you should look at adding some negative beta weighted delta positions to balance this out. When doing this, make sure to keep the profitable range of your portfolio wide enough. You don’t want a neutral portfolio with a $2 wide profit range.
Furthermore, you don’t want positions to completely cancel each other out. A position should still add something to your portfolio. For instance, shorting QQQ while simultaneously owning shares of SPY isn’t a good addition to your portfolio since QQQ and SPY are highly correlated and the losses in one position would completely cancel out the profits in the other.
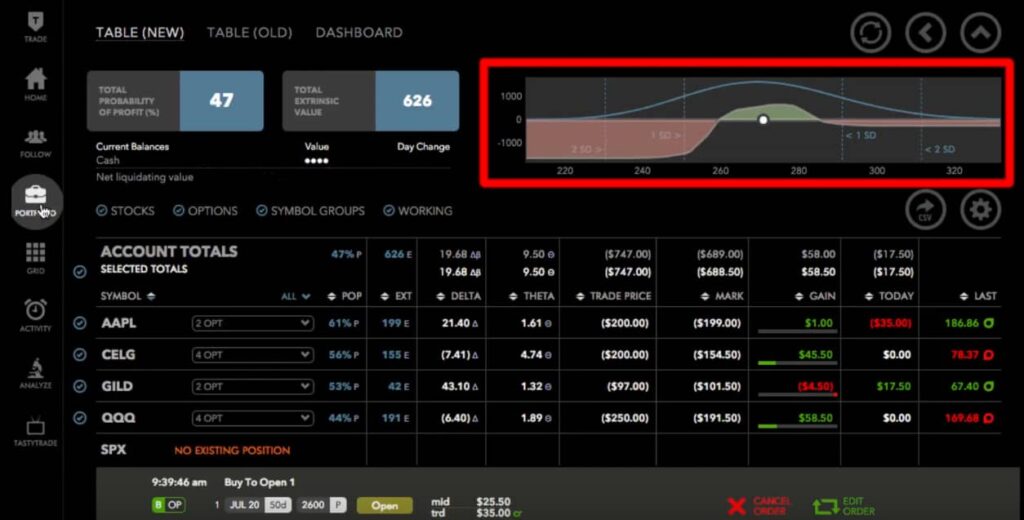
How to Beta Weight in Tastyworks?
You should now know the entire theory behind beta weighting. Now, let’s look at how you can actually use this in the real world. Theoretically, you could beta weight your positions by hand. However, this is quite cumbersome and not necessary since most good broker platforms do this for you. I will now show you how to beta weight in tastyworks.
For this, we must first navigate to the positions tab inside the tastyworks desktop platform. In the header of the window, you will be able to see the net beta weighted delta of your portfolio (marked in red). In the positions tab, you will be able to see the beta weighted delta of each position (marked in orange). Right next to it, you can see the normal non-beta weighted delta of the position (marked in yellow).
If a delta has the beta symbol (β) in front of it, it is beta weighted. Otherwise, it isn’t. If your positions tab looks different than the one below, note that you can add or remove these displays in the settings.
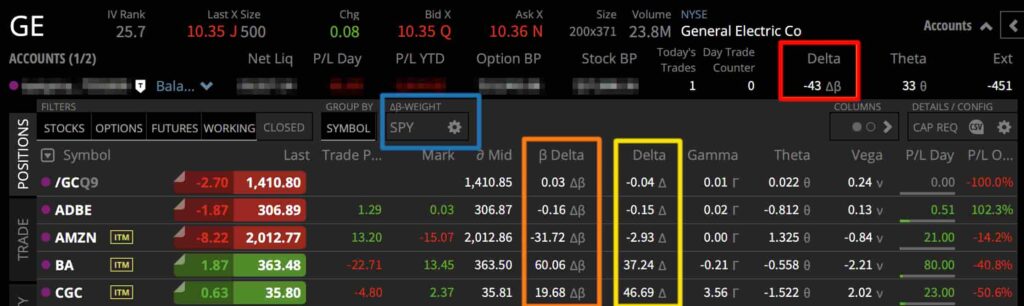
By default, everything is beta weighted to SPY. This, however, can easily be changed by clicking on the settings icon (marked in blue). If you decide to change this, make sure to choose a broad security that is correlated to as many of your positions as possible.
Speaking of correlation, you can see the 3-month correlation between a security and SPY in the right-hand sidebar under the security’s overview tab. Note that this is not the same as beta. To see the beta of a security, you will have to turn on the beta display in the settings menu.
Tastyworks also allows you to see the payoff profile of your overall portfolio. As of right now, this feature is only available in tastyworks’ web platform. To view this graph, navigate to the portfolio tab inside the web-based platform. Standardly, you will see the P&L profile of your entire portfolio in the top right corner. You can also deselect certain positions to view the risk profile of a group of positions. Furthermore, you can also view the potential impact of new positions on your portfolio here.
To learn more, check out my Full Review of tastyworks
Conclusion
This was a long post. So let’s briefly recap some of the most important points.
Beta weighting can be a great way to assess your overall market risk. Furthermore, it allows you to better compare the directional exposure of your positions. With that being said, it is still important to assess the risk of individual positions separately. Don’t focus all of your risk management efforts on beta weighting. Individual positions still need individual care.
Furthermore, it is important to use a highly correlated security when beta weighting. Applying beta weighting to uncorrelated positions won’t give you a realistic representation of your risk. In my opinion, it is best to use a broad market ETF such as SPY. But if you are trading a sector that isn’t represented by SPY, use some major market ETF in that sector.
Alternatively, you could also break down your portfolio into different sector groups and beta weight these individually. But if you don’t want to make it too complicated, just use SPY.
To truly reap the benefits of beta weighting it is important that your broker supports this feature. One of my favorite brokers that has beta weighting is tastyworks.
Check out my Honest Review of tastyworks
I hope you enjoyed this post on beta weighting. I am always open to feedback, comments, or questions in the comment section below. So make sure to let me know if you have any.
Heloo Louis, I really want to say a big thank you for sharing this article. I have heard of beta weighting before but never really understood it. Your post made it much clearer. I now not only know what beta weighting is, I also understand how I can apply it inside of tastyworks.
Keep up the work.
Thanks for the comment. I am glad to see that I could help.
Wow! This is really good to see and to be honest, I am drawn to the possibilities of the fact that it is a lot saver to get proper strategy right before trading and this beta weighting can really help boost the chances of making more worthy trades henceforth. This us great to see here and thank you so much for sharing here. Thank you and Thumbs up
Glad to see that you liked it.
The exposition of complex technical detail here is very impressive and the infographics are superbly done. You have succeeded in presenting and explaining very complicated material in a rational and systematic way. That is no easy task. The reader clearly needs a solid foundation in options and markets to understand the material here. I must say I am inspired to learn more. I have traded stocks for many years using a highly disciplined and automatic but simple approach. The more I learn about options and how they can be traded inexpensively I start to see that there are opportunities I have missed.
However, I would be very nervous in today’s markets launching into options trading. It would seem highly likely that the volatility we have seen in recent weeks would have pushed prices outside the safe zone of many investors’ iron condors for example.
Hi Andy,
Thank you for your comment. Even though the current market is very volatile, it is still very possible to trade options without risking too much. Many options strategies (including iron condors) allow you to limit your total risk. Limiting your total risk allows you to trade even in such a volatile market as now.
Despite the fact that I trade options, beta is something that I did not really use when it comes to my own trading.
Although in the past, I heard some online teachers sharing about beta, I did not really take time to understand the fundamental of how it works.
This article shows the correlation and how it is importance of beta application especially when it comes to tarding some high volatile stocks.
Thank you for such a detailed write out.
You are very welcome.
Hi! This has been a very useful post. I’ve wanted for a long time to calculate my risk profile but hadn’t found a nice suitable way to do it. I have fully understood how only taking the normal delta into consideration is not helpful. So bringing Beta into the equation can really give us an accurate idea of what we’re looking for.
Thank you very much!
Happy to see that you liked it.
Hi, Very nice and detailed post. I’m not from the US and looking for how to calculate the Beta weight of my options portfolio.
Do you know any XLS sheet or standalone application or website that calculates Beta weight for portfolio and plot curves like in your example?
Thanks.
Hi Akshay,
Thanks for your comment. If your broker doesn’t have beta weighting, you could theoretically calculate it by hand. Calculating the net beta-weighted delta of your portfolio isn’t that hard (as long as you have the delta values of your positions and the beta value for each underlying). How to do this is described in this post. But creating a beta-weighted risk graph isn’t as straightforward since you need the delta values of your positions for a wide array of price levels. So as long as you don’t have access to many theoretical delta values for your positions, I can’t really think of an easy way to do this.
I personally don’t know of any standalone services that offer this, but there might be some.
I am sorry that I couldn’t help.
Hi,
In the article you mentioned that “you can also view the potential impact of new positions on your portfolio here.” (on the portfolio tab). I haven’t been able to figure out how to see what adding a position to my portfolio would do to my overall portfolio without actually entering into that position.
Thanks.
Hi Chris,
I usually don’t use the web platform too much, so I might have made a mistake here. Instead of being able to view the impact of a new position to your entire portfolio, you are only able to view the impact of closing existing positions. The desktop platform also allows you to see the impact of a new position to other open trades in the same underlying.
Thanks! Very useful information, great post. I have a question: Can be possible to create a risk graph for your entire portfolio in EXCEL?
Thanks for advance!
Hi Emilio,
Thanks for the comment. Sure, that’s theoretically possible. If your broker has a beta weighting feature, I’d recommend using that instead since that’s much easier.
If that’s not an option, doing it yourself is possible, but this can be varyingly hard. If you only trade stocks, it shouldn’t be too hard since the Delta of a stock position is constant. If, however, you are trading options (or other non-constant Delta securities), it becomes a little more complicated. Then you probably would have to incorporate some options pricing model such as the Black Scholes model into the calculation to calculate Delta. If that’s something you’re interested in, you could check out my breakdown of the Black Scholes model.
Hello,
Thanks for the video. It was very instructive and provided me with a great view of what Beta Weighting can do to express my portfolio risk.
I have had a lot of difficulty to find some explanation of exactly what to do with that Beta Weighted Delta number for my entire portfolio.
I have developed a method for generating long and short alerts using a combination of technical indicators and executing debit call and put spread trades, once an alert is triggered. I’m using a maximum of 2% as risk guideline and recent market conditions have triggered many more short alerts than long, therefore the total delta of my portfolio of debit spreads is -1862.56 with a Beta Weighted Delta of -27.22.
I wanted to keep my positions but hedge them probably getting that Beta Weighted Delta to ZERO, during this period in which we have some important announcements in the next few days (CPI and FOMC). I believe in my alerts but wanted to prevent my portfolio from being hit by Powell and his persistence to manage the market up. I can’t find any video source, or any source at all that explains to me exactly what I should to with that -27.22 number. Should I buy one call spread with an approximate 27 delta to balance the entire position? Is one call enough? It seems to be, but I don’t know. Any help or referral to other educational material, videos, etc., would be highly appreciated.
Thanks,
Jay