
In this article, you will learn how to specifically analyze your trading performance so that you can become a better, (more) profitable trader. I will teach you everything from the data collection, how to perform an in-depth analysis of your trading to the importance of having regular performance reviews. If you take action and implement the advice that you will learn from this guide, you will see an improvement in your trading results!
Before I get down to the nitty-gritty, let me tell you why you should even bother analyzing your trades:
Tracking your trades and analyzing them is one of the only real proven methods that will improve your trading performance. Collecting real hard data will give you an edge in the markets. Data on your personal trading style is very valuable. You may have a certain perception of what you are good at and where you aren’t as good. But there is often a huge difference between the perceived and actual reality.
Having data and making use of it will open your eyes and eliminate the negative impact of that perception error on your trading.
Just imagine what it would be like if you had something that tells you exactly where you are losing money and where you are making money. With that information, you will be able to either change or just cut out the areas in which you are losing money and work on the winning areas. This shouldn’t be a one-time thing. This should be a continuously ongoing process of refining your trading style.
In the remainder of this article, I will tell you how to do exactly that.
How to Track Trades
First of all, if you haven’t done so already, you need to acquire the data on your trading. Once again, this should also be a never-ending process.
When collecting data on your trades, it is important to not only track the simplest data such as entry and exit price. Doing this is pointless as this wouldn’t allow you to gain a lot of insights into your trading which would mean that you can’t really improve anything.
Generally, the more data you have on your trading, the better. However, it is obviously not very feasible to track everything. Therefore, it is important to find a balance between the amount of useful data and the burden of actually collecting it. For instance, if it takes you two hours every day to track your trading data, you are probably doing something wrong (i.e. tracking too much data).
Some examples of useful aspects that I recommend tracking are:
- Entry Price, Exit Price
- Size (e.g. number of shares)
- Entry Day and Time, Exit Day and Time
- Underlying Asset
- P&L $ and %
- Commissions
- Notes and Lessons learned from each trade
- etc.
Now that you have an understanding of what to track, let us get into how you should track your trades. There are obviously multiple different ways to collect data on your trading and you have to decide which you think is best suited for you. The three most common/best ways that I can think of are:
- Dedicated Software
- Do it Yourself
- My Way
Dedicated Trading Journal Software
The first and probably most straightforward method to track data is using trading journal software. This allows you to either enter your trades manually or depending on the software and your broker automatically import your trading data from your broker platform.
The main pro of this method is that it is very easy.
Some of the cons are that gaining access to this software can be pricey and you usually can’t customize what you want to track in a big way.
Do it Yourself
Another possible way to track your trades is by doing it yourself. If you want to do this, I recommend using spreadsheet programs such as Microsoft Excel, Google Sheets or something similar. I don’t recommend using pen and paper as this would severely limit the analysis opportunities.
The pros of this method are that this is the cheapest way to track data and you can customize everything.
The main con, on the other hand, is that it is quite time-consuming. If you want to do everything yourself, I recommend creating some sort of template for you to use when entering and analyzing trades.

That is exactly what I did:
My Way
I created an Excel Trading Journal Template in which you simply can fill out ca. 10 fields (with information such as entry/exit price/time…) and everything else is done automatically. The template is highly customizable and automatically analyzes a multitude of different aspects of your trading without you having to do anything. But more on the different analysis features further down.
If you are interested in downloading a copy of my template, check out my Excel Trading Journal Template page.
Data Collection Pitfalls to Avoid
Before I move on to how to analyze your trading data, let me present you a few common data collection pitfalls that you should try to avoid! When analyzing your trades, you want to use the collected data to become a better trader, not a worse one. To make sure that you don’t become a worse trader, you have to make sure that your data is reliable. To make sure your data is reliable, avoid the following:
1. Not Having Enough Data
A common mistake is to base fundamental changes in your trading style on a too small sample size. If you analyze data, make sure you have enough of it. DO NOT change or adapt your entire trading style based on a handful of trades. If you only have tracked a few trades, they might be outliers which would mean that they wouldn’t be a good representation of your actual trading performance. So always make sure to base changes in your approach on a big enough number of trades that indicate the same.
2. Tracking Useless Data
Even though it is usually true that more data is better, you should still focus on relevant data. Don’t track something just for the sake of tracking it. Only track it if you think it might help you understand your winning and losing trades better.
3. Tracking Unusable Data
Besides avoiding tracking irrelevant aspects of your trading, also try to make your data usable. That is also why I recommend using a spreadsheet program such as Excel. This will allow you to present the collected data in a useful visual manner. Furthermore, it allows you to perform arithmetic functions on it (e.g. calculating averages, totals…).
An example of almost unusable data would be something like this:

If that’s how you track your data, you might as well let it be.
4. Jumping to Conclusions
When analyzing data, use common sense and don’t jump to conclusions. In other words, try to work like a scientist. You might uncover weird correlations (especially if you have inaccurate/useless data). If something doesn’t make sense, investigate it further. Generally, make sure to be thorough before you change how you trade.
5. Being Selective
From personal experience, I can say that sometimes it can be tough to sit down and track bad losing trades. Human psychology wants us to forget bad experiences. But reflecting on and tracking bad trades is often one of the most important things because it is often these trades that give you the most opportunity for improvements.
This is also related to the reliability of your data. If you are selective in your data collection process and only track the good winning trades, your stats will be close to useless and they will not be a real representation of your trading. So make sure to track all your trades!
6. Not Segmenting the Data
Not differentiating between your data is another common mistake. Most traders have more than one trading strategy. If that’s the case for you, make sure to track different strategies differently. If you treat all your strategies as if they were one, you will have a very unclear picture of your trading. Instead track everything individually and analyze different strategies separately. That is also why I divided my Excel Template into different sections with multiple subsections.
Trading Data Analysis
Now let us finally get into how you should/could analyze your trading data to become a better trader. I will present this with the help of my Excel Trading Journal Template. Obviously, I recommend that you use my spreadsheet as well. However, if you have another preferred way, that is totally okay as well. You will still be able to get good insights or at least some inspiration for how to analyze your own data.
If you use my template, you won’t really need any Excel experience. In addition to that, you also won’t really need any statistics experience or anything of that kind either. I created it in a way so that it is extremely easy to get a clear picture of your own trading performance even without a lot of analysis. I made use of different color sets, a multitude of different charts, graphs, and tables to accomplish this. If you want to create your own spreadsheet, make sure to do the same!
I will not present all the different analysis features of the template. Let’s start at the top.
Top of the Template
The top of the template is mainly designed for you to enter your trades. However, it is also possible to get a good impression of the development of your trading by looking at this section of the spreadsheet. You can mainly do this by looking at the different colors of the P&L column. The more green they are, the more (consistently) profitable you seem to be. A lot of red means that you still have to work on your consistency. The opacity of the colors indicates the size of the loss or gain (darker means bigger).
Furthermore, you could look at the notes and lessons learned of some of the outstanding trades (e.g. biggest gains/losses).
At the bottom of the trade entry section of the template, you will have a summary bar that summarizes some of the major stats for each strategy (P&L, Average Time in a Trade, Win %, Average % Gain/Loss, Average $ Gain/Loss). This is a great place to get a good overview of the performance of each strategy.
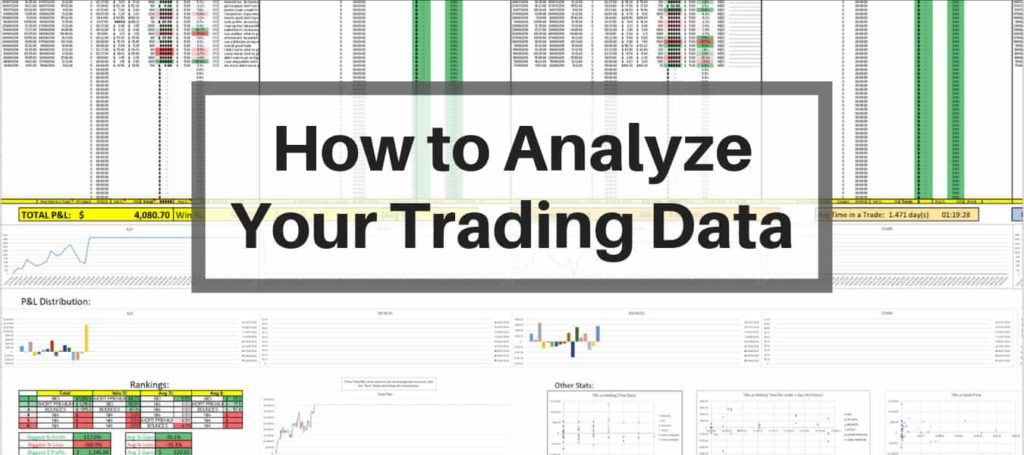
Big Summary Bar
The next section of the Excel Trading Journal Template is a big summary bar in which you can learn about some of the stats of your overall trading performance. Some of the things listed here are:
- Total P&L
- Win %
- Average % Gain/Loss
- Average $ Gain/Loss
- Total Commissions Paid
- Number of Trades
- Average Time in a Trade
- P&L Today
- P&L Week
- P&L Month
- P&L Year
This can give you a very good overview of your entire trading performance. This is especially good for regular performance reviews such as daily/weekly/monthly/yearly reviews. However, I recommend focusing more on the stats of the individual strategies as they tell the whole story. The big summary bar just sums everything up to give you a broad overview of your trading. For deeper analysis, you should look at each strategy separately.
![]()
Individual Strategy P&L Line Charts
In this section, you will be able to view P&L line charts for each strategy. This allows you to see the entire development of your trading with that strategy in one place. It shows the periods in which you were trading better and the periods in which things weren’t going as splendid. A good idea here would be to go to the top section and look at the notes (and lessons learned) on your trades in the best and worst periods. Hopefully, this will shed light on the reason for the worse (or improved) performance which could give you an idea of how to adapt your trading style in the future.
Individual Strategy P&L Distribution Bar Charts

This section allows you to easily compare the size of the different gains and losses of each strategy. Ideally, your wins are generally bigger than your losses. Otherwise, you would need a lot more wins than losses to achieve profitability. Looking at these charts is a good way to learn about the risk to reward ratio of your current trading styles. If the losses for a strategy are much greater than the wins for the same strategy, you could, for instance, consider cutting losses faster or taking profits later.
Another way to use this section is to look at some of the notes of some of your notable wins or losses to get a better understanding of what went right/wrong on those trades. Doing this might help you avoid similar big losses and repeat big gains in the future.
Ranking Tables
Next up are the strategy rankings. This is a table in which all your strategies are ranked by Total P&L, Win %, Average % Gain/Loss and Average $ Gain/Loss. This allows you to quickly see which strategies are working best for you in the just-mentioned aspects. If you have enough data and there is a clear differentiation between your best and worst strategies, you might want to consider focusing more on your best strategies. You could even consider dropping your worst strategy from your arsenal if you don’t see a way to improve its performance.
Besides the just-mentioned table, there are also two more tables in which you can view your Biggest % Profit, Biggest % Loss, Biggest $ Profit, Biggest $ Loss, Average % Profit, Average % Loss, Average $ Profit and Average $ Loss. These tables exist to let you know how your best, worst and average trades look like. One way you could use this information is to look at the notes of your best and worst trades and learn from them.
Furthermore, the averages give you a good general understanding of your trading performance. The next time you trade, you could, for example, compare the stats of your open positions to the stats of your average trades. Doing this could potentially help you find out when to take off the trade.

Total P&L Waterfall Chart
This chart shows the development of your entire total P&L on a trade by trade basis. Once again, this can be used to get a quick and good overview of your overall trading performance. In my opinion, it is especially useful for longer-term performance analysis such as monthly or yearly reviews.
P&L vs Holding Time (Days and Intraday) Scatter Diagrams
These are two scatter diagrams that compare the P&L of each trade of each strategy to the holding time of it (once for day trades and once for longer-term trades). This allows you to identify the most and least profitable time frames for each strategy. Try to use this information to adapt the holding time of your future trades.
For instance, if all your most profitable trades for a certain strategy occur when you hold your positions for only a few minutes and most of your biggest losses come from the trades that are held for multiple hours, you might want to take off your trades faster in the future.
P&L vs Stock Price Scatter Diagram
This diagram compares the performance of the trades of each strategy to the stock price. You could use this diagram to find out which price range is best suited for a certain trading strategy. An example here could be that you notice that most of your losing trades for a certain strategy come from lower-priced stocks. A follow-up action to this might be to focus more on higher priced stocks when trading that strategy in the future.

P&L vs Time of Entry/Weekday of Entry Scatter Diagrams
These are two more scatter diagrams that compare the P&L of each trade of each strategy to the time of entry with respect to time of day and day of the week. One thing you could potentially notice from these diagrams is that your trading performance for a certain strategy is significantly lower (or higher) during certain times of the day (or on specific days of the week). If this is the case, you should try to investigate why this is the case. If you can’t find a way to improve your performance, you could just stop trading that strategy during the periods with decreased performance.
I hope these examples of what I added to my Excel Trading Journal Template could give you a good idea of how analyzing different aspects of your trading could help you discover areas of potential improvements. Ideally, you should not look at each section in isolation like I did here. Instead, take more than one aspect into account when analyzing your trading strategies.
You might have noticed that almost everything on my template is divided into different strategies. That is the case because I find it very important to treat different strategies differently. Showing everything for each strategy separately instead of showing everything together paints a much clearer picture of your trading performance. In other words, dividing everything into different strategies is a way to dissect your overall P&L. It shows you exactly where the most money is being made and where the most money is being lost.
The Importance of Regular Performance Reviews

Now that you know how to track trades and how to analyze the tracked data, let me tell you about the importance of actually analyzing your data on a regular basis. I recommend reviewing your trading performance as frequently as possible. This will make it much more useful.
Here are some routines that I recommend implementing into your trading life:
- End of Day Analysis: In my opinion, it is important to review your own performance after every trading day. This can be combined with collecting the data. For example, my Excel Spreadsheet doesn’t allow the automatic collection of data from your broker platform. But in my opinion, that is a good thing because it forces you to manually enter and think about your trades again. So even if you aren’t in the mood, you have to reflect on your trades again. Furthermore, this helps with avoiding making bad trades.
In addition to entering your daily trading data, you should also just take a few minutes and think about how you feel your trading was on that day. Was it good? If not, why not? Were you disciplined? Did you stick to all your rules? …
- Weekly Performance Reviews: Weekly review sessions are a very good thing as well. Just take a few minutes and look at how your trading performance in that week was and compare it to previous weeks. To get a fast impression of your weekly performance, you could look at the Weekly P&L stat in the template. During weekly review sessions, you could also set achievable short-term goals for the next week.
- Monthly Performance Reviews: Make sure to look back at your trading after every month. Ask yourself what you did good and what you didn’t do so well? What do you want to do better next month? When answering such questions, I don’t recommend thinking about P&L. Instead, think of how you could make better trades. For example, don’t set yourself the goal to make X Dollars next month. Instead set goals like avoiding certain mistakes, being more patient with certain trades, cutting losses faster etc. If you do this, your trading performance will automatically improve.
To get a fast impression of how your monthly performance was, you could look at the monthly P&L stat and at the P&L charts in the template.
- Yearly Performance Reviews: Last but not least, you should look back and reflect on your trading year at the end of every year. Are you satisfied with your trading for the year or not? Why are you or why aren’t you? How did your performance develop throughout the year? Did it get better or worse?… Ask yourself questions like these and set new major goals for the next year. Once again, I don’t recommend solely setting goals in terms of making a certain amount of money.
I actually recommend starting a new blank spreadsheet at the beginning of every year (if you trade often enough). Doing this allows you to later always go back and look at a very in-depth spreadsheet on your trading performance for every year.
Depending on the frequency of your trading, you should adjust the frequency of the review sessions. For example, if you only trade once a month, it probably doesn’t make a lot of sense to analyze your trades on a daily basis.
I know that going back and analyzing all your trading data can be cumbersome. But it is very important, so just do it! Try to take a few minutes every day and develop a consistent and good habit.
Conclusion

I hope this article helped you understand the importance of personal trading data. If you haven’t done so already, make sure to track your trades from now. Furthermore, make use of the collected data by analyzing it! This might seem like an overwhelming thing to do. But if you have the right tools, it really isn’t that hard.
With my Excel Trading Journal Template, you simply have to fill out a few fields and everything else is done for you. The data is analyzed and presented directly after entering your trading data. You will immediately have charts, stats, tables, diagrams and more on a multitude of different aspects of your trading. It really doesn’t get much easier than this.
Alternatively, you could also track your data yourself or use dedicated software to do so.
Summed up, the goal of collecting and analyzing data is to identify where the most money is being made and where money is being lost. This is very valuable information as it allows you to eliminate the areas that are losing money and highlight the winning strategies. Doing this over and over again will make you a better, much more profitable trader!
So please do yourself the favor and don’t ignore this advice. Track your trades and analyze them!
I really hope you enjoyed reading this article and learned something new.
If you want to implement my advice, make sure to grab a copy of My Excel Trading Journal Template.
I once traded in forex and options and to a large extent, i was successful at it. One of the things i did that lead to my success was keeping track of trades. When you follow a strategy today and its profitable and you don’t keep track of your data while practicing this strategy, tomorrow when the market environment changes and you need to adjust your trading pattern, you will be left in the wind. The easiest way to keep track is by creating a detailed excel trading journal template, and building up from then on. This article is super detailed and amazing, following this instruction will sure lead you to success in trading. Cheers
I couldn’t agree more. Thanks for your insights.
Many thanks for your article, very informative. I started out trading recently and am currently in the learning phase, looking around for all good sources of information as I want to do this full time. I have subscribed to your newsletter as I don’t want to miss out on information you send about trading options.
Best regards
Awesome! I am glad you enjoy my content and are willing to learn.
Thank you for the detailed information. Your site is so informative. I have been researching a lot about trading. I have not come accross anyone who explained as you did.
You don’t recommend using pen and paper, I thought it was the easy way. Do you have any recommendations of any platform that a person can start trading on?
Thanks for the comment. I am very happy to hear that you enjoy my content. My favorite broker platform is tastyworks. However, make sure to educate yourself before risking any substantial amount of real money. If you don’t know exactly what you are doing, you shouldn’t risk losing your hard earned money yet.
A very good and detailed post on how to track your trades. I do understand the importance of doing this and having a precise and regular system. My better half is into trading and loves to analyze. I have seen some of his system on his computer but I will still pass your website to him. It could very well be that downloading the Excel Trading Template Page might be of help to him.
Regards, Taetske
I am glad to hear that you liked this article and understand the importance of tracking trades.
I would love to become a great trader some day and also a bjg investor, for now I am using iq option with a demo account in order to practice, from your article I have learn something very valuable, tracking one’s trades is important, and more important is to learn from our mistakes than our accomplishments
Your post reminds me of this quote
“Those who do not learn from History are condemned to repeat it”
What are the aspects that are unuseful to track?
What are the best trading strategies?
I already sign up for your free course. I am so excited to learn.
Thank you for taking the time to make the template and writing this important post!
Thanks so much for the comment Fredery. Great to see that you signed up for my course. I completely agree with the quote that you mentioned.
Which aspects are useless might depend on your trading strategy. But here are a few things that I personally wouldn’t consider very relevant:
-What you ate before the trading session
-The weather outside
…
But depending on the trading strategy, even things like market cap might be irrelevant. If you start tracking many different aspects, you should realize which aspects are relevant for your strategy or which aspects are completely uncorrelated to your trading performance. So you might have to experiment with this in the beginning.
As for best trading strategies, I can’t give you an answer. In my opinion, there is no such thing as a best strategy. There are countless of good trading strategies. The strategy that is best for me is not necessarily the best for you. It depends on your personal preferences, trading style etc.
I hope this helps.
PS. I can’t recommend trading with IQ Option. You could check out my review of IQ Option to get to know my thoughts about them and their legitimacy.
Nice !
Is it downloadable or works thru your system ?
Thanks for your question. It is an Excel file, so it is downloadable and works in Excel.