
Historical and implied volatility are two very important concepts that every options trader should be familiar with. In fact, if you take a closer look at these two, you will be able to identify an inefficiency that can create an edge for certain option traders.
In this article, I will explain what the differences between historical volatility vs implied volatility are, how volatility behaves, what exact edge option premium sellers have and how to take advantage of this edge. I have mentioned this edge a few times throughout my Intermediate course. However, I have never gone into the details. That is what this article is dedicated to.
Video Breakdown
Check out the following video in which I break down how to effectively trade options like an insurance firm.
Historical Volatility vs Implied Volatility – Is There An Edge?
Implied volatility (IV) is the expected volatility and it can be derived from option’s prices. Usually, when option’s prices are high, implied volatility also is high and vice versa.
It is very important to understand that implied volatility (IV) is not the same as actual or historical volatility (HV). Implied volatility is the expected volatility meaning that it is forward-looking, whereas the actual volatility is backward-looking. Implied volatility is trying to predict the actual volatility.
Here is an analogy to help with the understanding of historical volatility vs implied volatility: the weather forecast. The weather forecast tries to predict the future weather. But is the forecasted weather always the same as the actual future weather?
No. In our day and age, technology has come very far, but nevertheless, the forecasted weather isn’t always the same as the actual weather. Sometimes, the forecast is spot on and other times it isn’t even close.
The same is the case for implied and actual volatility. The forecasted volatility (IV) is not always the same as the actual volatility (HV).
This means implied volatility is the only factor in options pricing models that is not observable. All the other factors are precise and can be measured: strike price, expiration date, the price of the underlying… Implied volatility can only be calculated if you know all the other variables. But don’t worry, you won’t have to calculate IV yourself. Nowadays, every good broker platform will calculate IV for you.
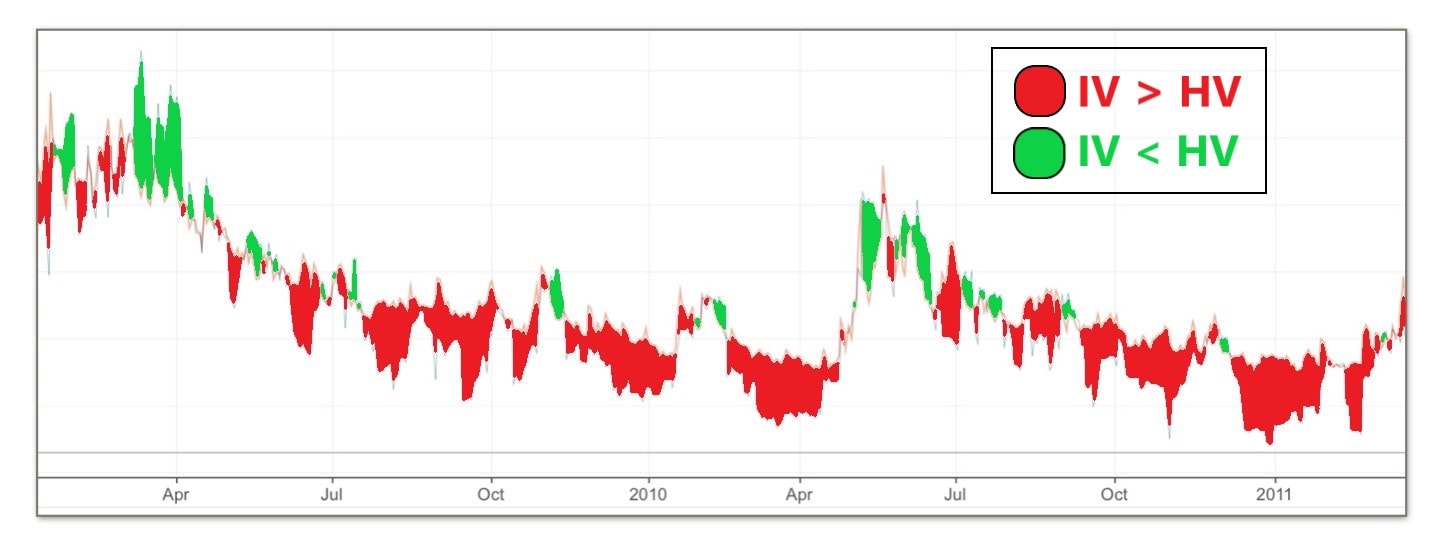
If you compare historical volatility vs implied volatility over the years, you can recognize an interesting pattern. The following two charts compare the S&P 500’s implied volatility (VIX) to the S&P 500’s actual volatility.
Can you recognize anything special?


The vast majority of the time, implied volatility has been higher than the actual volatility. The market has expected more than actually happened most of the time. In fact, a research report from Cambridge Associates states that implied volatility has overestimated historical volatility almost 87% of the time between 1990 and March of 2011.
Think about this for a second. What does this mean for option traders?
If option’s prices tend to be high in times of high implied volatility and implied volatility usually, has been higher than actual volatility that means that options have been overpriced most of the time. This means that option sellers have an edge because they are selling these too expensive options.
That is why option premium selling works!
Just look at the following historical vs implied volatility chart. The red parts are the periods during which IV was overstating HV and the green parts are the periods during which IV was understating HV. As you can see, implied volatility was overstating historical volatility most of the time!
Think of options selling as an insurance company. Insurance companies sell you insurance because they know that statistically, they won’t have to pay out a lot of insurances.
The same goes for options selling. You sell options because you know that statistical options have been overpriced and you, therefore, have an edge.
Note that this edge doesn’t exist all the time. Implied volatility has been overstating historical volatility most of the time, but not all the time. Sometimes, the opposite was the case and other times implied and historical volatility has been more or less the same.
So how do we know if we have an edge or not?
We don’t. You can’t tell when implied volatility is going to overestimate actual volatility. That is also one reason why you should keep your position size small. Just because there is a statistical edge does not mean that that edge exists all the time. Sometimes, trades will go against you. To stay in the game, it is essential to trade small. Ideally, you should risk less than 5% per trade.
If you want to learn how to take full advantage of this edge, make sure to check out my free options trading education!
The Behavior of Volatility
Hopefully, you have realized by now that volatility plays a huge role in the world of options trading. Therefore, it is very important to be familiar with the behavior of volatility when selling options.
Volatility moves very differently than stock prices. Volatility is a mean-reverting asset. It usually trades around a mean and if it moves from this mean it tends to revert back to it relatively fast.
Just look at the following chart. It is a chart of VIX, an index that measures the S&P 500’s implied volatility.

As you can see, implied volatility does not move like most other prices or have you seen a chart similar to the above as a stock chart before?
The mean on the VIX chart above is somewhere around 20. The price never really deviates from this mean a lot for long periods of time. Most spikes are followed by big drops back to this average.
So how can an option trader take advantage of this mean-reverting behavior of volatility?
Option selling strategies usually have a negative Vega which means that they profit from decreasing IV and lose value from increasing IV. This means an option trader could sell options when implied volatility is high and thereby ride the volatility back down to its mean.
It can be very hard to predict these big spikes in volatility. However, it is not near as hard to predict the big drop back down after a spike. Therefore, you should focus on options selling strategies that profit from decreasing IV instead of focusing on option buying strategies that profit from increasing IV.
So make sure to always look at IV and focus on high IV assets for your options selling. To find out if IV currently is high or low, use IV Rank. IV is considered relatively high when IV Rank is over 50. However, the higher IV Rank is, the better. When IV is very high and IV Rank is near 100, you could consider increasing position size to some extent.
The Importance of a Long-Term Approach
It is very important to have a long-term approach to option selling. Otherwise, you won’t be able to take (full) advantage of the overstating implied volatility.
You can’t tell if option premium selling works after a few days, weeks or probably even months. A few trades just aren’t a big enough sample size.
Remember, you have a statistical edge. To take advantage of this statistical edge, you will have to have a large enough number of occurrences.

Let me give you an example of a casino:
For the sake of this example, I will focus on the game of roulette. It is generally known that the casino has a statistical edge in roulette (or in any game that they offer). That is also why the casino is the one making money and not its customers.
Now think about the strategy that casinos use to make the most money with roulette.
They want their customers to play as many games with relatively small bets per game. Why is this the case?
Because they know that the bigger their sample size, the closer the actual outcome will become to the expected outcome. This is also referred to as the law of large numbers. Casinos usually have betting limits meaning that you can’t bet more than a certain amount on a single game of roulette.
These betting limits exist because the casino knows that their edge isn’t that great on a single game. They ‘only’ have an edge of a few percents. Over the long run with a large enough number of occurrences, these few percents are more than enough to make the casino rich. However, in a single game, these few percents aren’t enough to guarantee the casino a profit.
You should think the same way about your options trading. Try to trade like a casino: small and often. The greater your number of occurrences, the more you will be able to take advantage of the overstating IV. Furthermore, always remember, that your edge isn’t great on a single trade and therefore, you should keep your position size small!
This does not mean that you have to put on 100 trades right away. It just means that you should have a long-term approach. You shouldn’t expect to be profitable on every single trade. You should trust the numbers just like a casino. The bigger the sample size of good trades, the better. So 1000 trades are better than 10 trades.
Once again, I am not saying that you should put on tons of trades straight away. It is totally fine if 1000 trades will take you years. Just stick to it and don’t give up after a few trades because a few trades aren’t enough to take advantage of a statistical edge.
Consistency is Only Half of the Equation
As you can see, consistency is key. In the long run, the numbers should work themselves out.
With that being said, it is essential to understand that consistency isn’t everything. If you consistently put on bad trades, you won’t become a successful trader. It is paramount to your success as an options trader to follow all the steps and thereby, focus on putting on good trades only.
- You should always be on the right side of implied volatility!
- You should always keep position sizing small!
- You should focus on option premium-selling strategies!
- You should manage your positions correctly!
- …
If you just skip one of the steps, it can be detrimental to your success. For instance, if you aren’t taking IV into account, you could be missing out on the edge that makes option premium selling a viable strategy.
So make sure to be consistent and stick to all the rules!
To learn all the rules, make sure to check out my free options trading courses!
Conclusion
In conclusion, it is important to understand the differences between historical volatility vs implied volatility:
Implied volatility is the expected volatility, whereas historical volatility is the actual volatility.
Statistically speaking, implied volatility has been overstating historical volatility most of the time. This gives option sellers an edge.
It is best to trade option selling strategies in times of high implied volatility due to their negative Vega and the mean-reverting nature of volatility.
Furthermore, it is essential to have a long-term approach to option selling!
Last but not least, it is very important to be consistent and disciplined with your trading!
If you have any questions or comments, make sure to let me know in the comment section below!
If you are reading this as a part of the Intermediate Course, you can move on to the Intermediate Course Quiz now.
Amazing post backed up with great facts and charts. I too believe that the long-term mentality is very important when trading, you can’t assume you will strike gold right away it takes time.
Hi, I am trying to understand Implied Volatility. It sounds like the trader will try to forecast the volatility. Is that close? Also, if the options are long term, does that mean you have to check them less frequently? Or is this the type of trading where you are in front of your computer for long periods of time?
Hey Judith,
Thanks for your comment. First of all your guess of what implied volatility is was very good. I wrote an article about implied volatility. Check it out here.
The type of options trading I teach actually does not require you to check your positions constantly. But in general for trading I would recommend to set price alerts, so you know when you have to check your positions. I have a more in depth article on that here.
Thank you for starting off slowly and explaining the different between Historical Volatility vs Implied Volatility. I usually only buy shares via a “buy and hold” strategy so I am not up to date with genuine trading terms. I liked it when you said thinking long term plays an important role in this strategy. I also liked your casino example. I know that I have “bet” on some options contracts in the past and I got burnt. Ouch!! I was just wondering if you only trade US stocks or if you do international ones as well?
Thanks for the comment.
I mainly trade stocks listed on the US exchanges (NASDAQ, NYSE, AMEX) because these tend to have the most liquidity.
If you have trouble with trading terms, you could check out my free trading glossary in which you can always look up a wide variety of seemingly complicated trading-related terms.
Loved reading your post. I am new to trade options but I am willing to learn. That is how I found your website and I am really happy I did.
I was interested in trade and stock exchange but never commited to it.
Thank you for this thorough and deep analysis. Can you let me know when did you start with trade options?
Regards,
Strahinja
Thanks a lot for your comment. I am very glad that you enjoyed the article and to see that you are willing to educate yourself before risking hard earned money. You can read about me and how I got started on my About Me Page.
Hi Louis,
Thanks so much for teaching us so much! I’m a little confused about IV.
You mentioned: “But don’t worry, you won’t have to calculate IV yourself. Nowadays, every good broker platform will calculate IV for you.”. What I’m confused about is: each stock option (call/put) strike price and date to expiry has their own IV. So my questions are: 1) Which IV do are you referring to or which do we actually use to determine whether it’s high or low? 2) Is the IV for a particular stock displayed on the broker platform on the day I’m looking at it the IV we want to use? If yes, is that IV derived from the ATM options? The call option, or the put option? 3) IV tends to be higher than actual HV. But in the past few months, the IV for AAPL seemed to be higher than HV (at least from what I saw in my Interactive Brokers platform). Am I doing something wrong?
Looking forward to your reply! Thank you so much.
Hi Vince,
Thanks for your comment.
Usually, a weighted average of multiple ATM options (both call and puts) is used to calculate an IV for a stock. To determine if IV is high or low, I recommend using IV Rank. IV Rank compares the current IV level to the past year of IV data and tells you how relatively high or low the current level is. I am not sure if IB offers this feature. Tastyworks is one broker that definitely offers it.
Historically speaking, IV has been overestimating HV on certain assets. However, the difference isn’t huge and there certainly are periods and stocks where this isn’t the case. Especially, in times of low IV, HV can be higher. So don’t worry if IV isn’t greater than HV on a certain stock over a given time period.
I hope this helps. Let me know if you have any other questions or comments.
I’m not quite getting how to profit off a sell. It seems like I have to wait for expiration which could be more than a month. How can I make a daily income using these methods? Starting with 10K what optimal contract price range should I be looking at for each trade?
Hi Steve,
You don’t have to wait until expiration to profit from a position. You always have the possibility to close an option position before expiration. But note that options selling isn’t day trading. You can achieve an unrealized profit most days, but the time-frame is typically close to a month. If you want to learn how to day trade, this is not the right strategy.
As for the contract price range, I can’t really give you a specific number. It totally depends on the underlying and position. As a general rule though, I don’t recommend risking more than 5% on any single position (ideally a lot less).
Though I am not well conversant with the option trading yet, it was a fruitful experience with the courses. All the contents of the lessons are very precise and to the point. Actually I was not aware of anything about option trading but now I gained some confidence. Supporting videos are great and your mesmerising voice, nobody can dare to unlisten it.
In short – A GREAT LEARNING EXPERIENCE.
Thank you very much for your positive feedback. I am very happy to see that you liked it.
Implied volatility is based on the Black-Sholes price of an option – which assumes that log-returns are normally distributed. Have you considered that maybe the fact that implied volatility is generally higher comes down to the fact that, in reality, log-returns have fatter tails?
Hi Josh,
Thanks for the comment. I totally agree that it is important to keep the flawed assumption of normally distributed returns in mind. In fact, I even have a separate article on the distribution of returns which you might find interesting.
But even though equity returns historically haven’t been normally distributed, statistically speaking, volatility has been trading at a premium. If you want some sources for further reading on the volatility risk premium effect, I highly recommend this BlackRock paper, and this Quantpedia entry.
Otherwise, you could also check out some of the sources linked in the description box of the embedded YouTube video.
I hope this helps.
What charting software to you use for tracking IV / HV (or do you import data and make your own charts)?
Hi Joe, the charts in this post are custom created by me.